# Mixed Charts
Plexus Cloud (opens new window) allows the generation of charts with data from different PlexusLABs (with a 14-day history), providing flexibility when combining data from various sources.
An example use case could involve acquiring data from temperature sensors located in two different ecosystems, each managed with PlexusLAB.
By its nature, this feature is active only when at least 2 PlexusLABs are configured in the Device section.
WARNING
Important General Considerations and Usage Limits
The data intersection performed by PlexusCloud does not guarantee exact synchronization among the various PlexusLABs sending data. This is because the data sent by each PlexusLAB has its intrinsic timestamp taken from the machine where the system resides.
If there are machine-level time discrepancies, such as if at a specific moment of the day machine A marks 10:00:00, but machine B marks 09:59:58, these discrepancies will inevitably be replicated in the Mixed Chart.
Ubuntu allows the possibility of synchronizing all machines in the same internal network through low-level services like "chrony (opens new window)", but any configurations go beyond the responsibility of Plexus Automation. Plexus Automation and Bioforcetech do not take responsibility for any incorrect configurations that may compromise the security of your system.
The recommended version of PlexusLAB, installed on the systems from which you want to intersect the data, is version 0.45.4. Refer to this link for instructions on how to update and to the release notes.
# Creating an MC
To create a new Mixed Chart, navigate to the specific page through the sidebar, click on the green button in the top right, and finally on "Create."
In the popup that appears, enter the chart name and the variables to acquire (right dropdown), starting by choosing from which device (left dropdown).
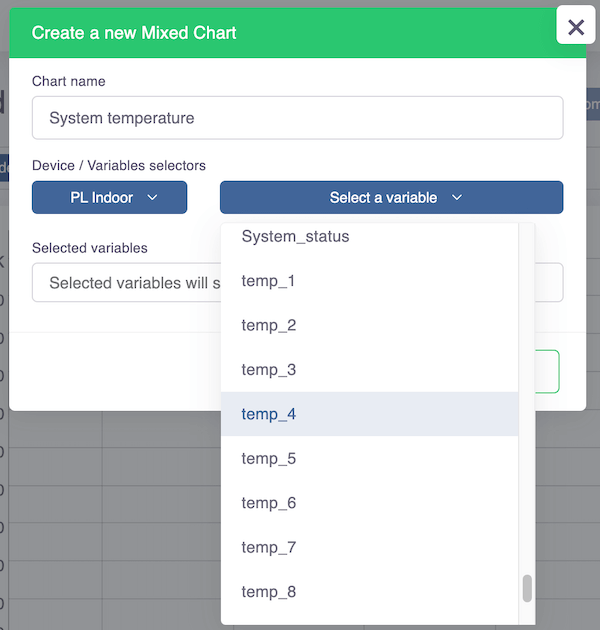
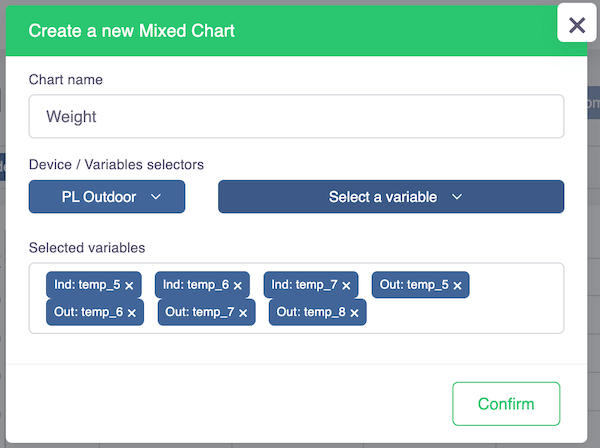
Every time you click on an item from the list of variables, it will be automatically displayed in the "Selected variables" field. If the device from which you are drawing has an associated "Short label" (info here), it will be used as a prefix for the variables; alternatively, the device name is used.
TIP
It is recommended to set a "Short name" for all devices before starting to create your first Mixed Chart. If it changes later, the mixed chart will no longer be visible, and you will need to re-enter the variables to acquire.
If necessary, you can remove a previously selected variable by clicking on the "x" in the "Selected variables" list.
At the end, by clicking the "Confirm" button, you can save the Mixed Chart.
# Important Note
Upon saving, PlexusCloud will start populating the data for the Mixed Chart starting from "14 days ago," proceeding in blocks generated every 60 seconds. This means that the most recent data will be available only after about an hour has passed.
In the "Charts" list that will be populated, where you will find your chart, the clock indicates that you still need to wait a few minutes before proceeding with the data visualization.
# Modifying an MC
To modify a Mixed Chart, navigate to the specific page through the sidebar, click on the green button in the top right, and finally on "Info/Update."
In the popup that appears, you can change the chart name and/or the acquired variables.
Note: It is important to remember that, in case the set of variables is modified, PlexusCloud will perform a complete recalculation of the history, as is done when creating a new Mixed Chart. Therefore, refer to the premise mentioned above.
# Deleting an MC
To delete a Mixed Chart, navigate to the specific page through the sidebar, click on the green button in the top right, and finally on "Delete."
By confirming the prompt that appears, you will command the deletion of the Mixed Chart and the related previously generated data.