# Report Configuration
Plexus Cloud (opens new window) allows you to extract and produce CSV or PDF files with simple or combined data coming from your blackbox. This is useful whenever keeping track of processes is needed, importing datas into Excel in order to compute other results and create customized charts.
For example, if you have placed a bunch of temperature sensor around your plant, you can easily evaluate the average heat for the last 10 hours.
This page shows a list of user defined reports, each one described by:
- Name, name (a label);
- Description, description, optional;
- Status, report status (draft or published);
- Reference, associated blackbox or mixed chart, mandatory
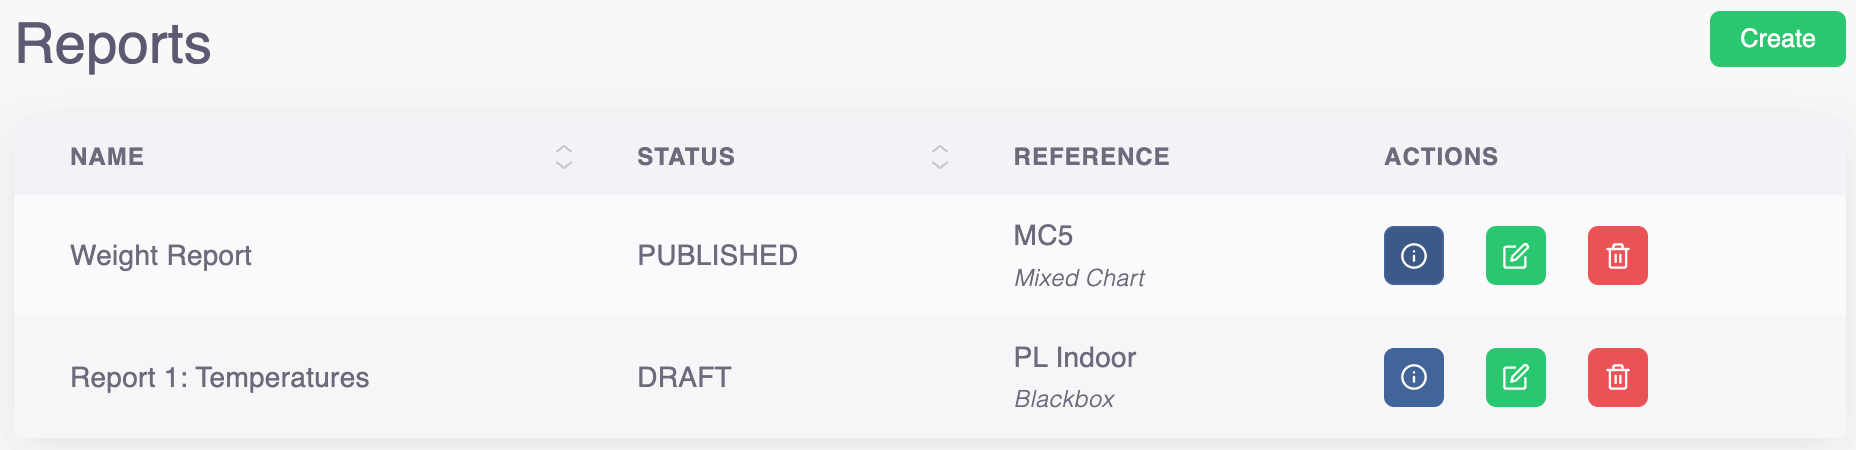
A report needs to be built on top of one or more sections before it can be published, thus to be visible in the blackbox page to be generated.
TIP
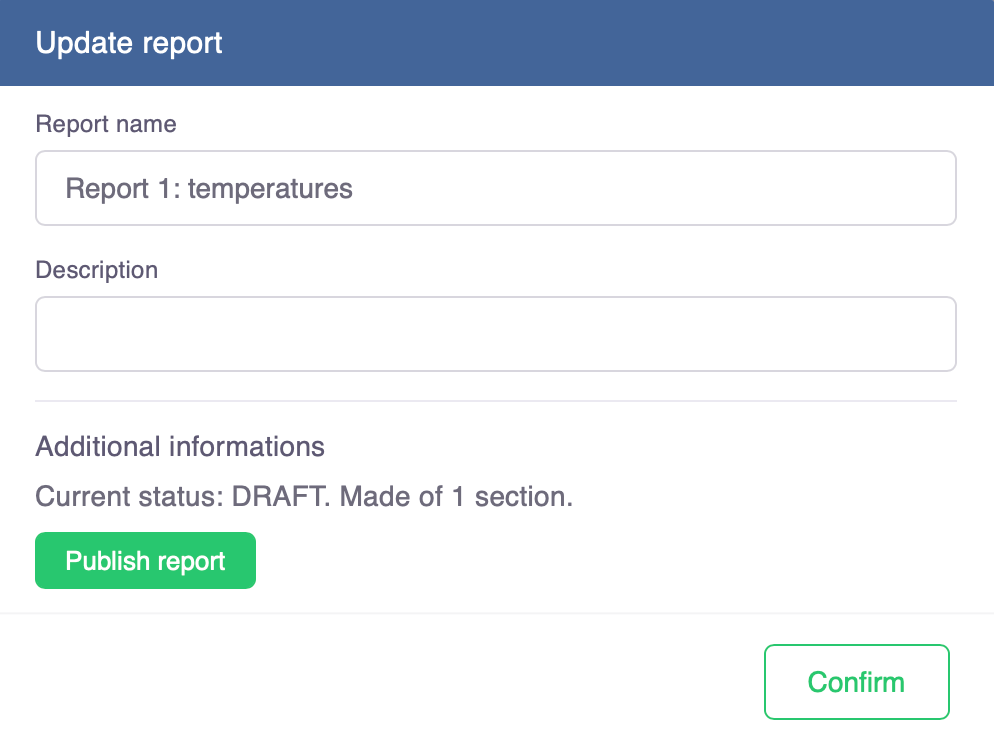
Once you are done with creating sections and you want to start looking at your results, you must click on the Info button in the report list and then press the green Publish Report button.
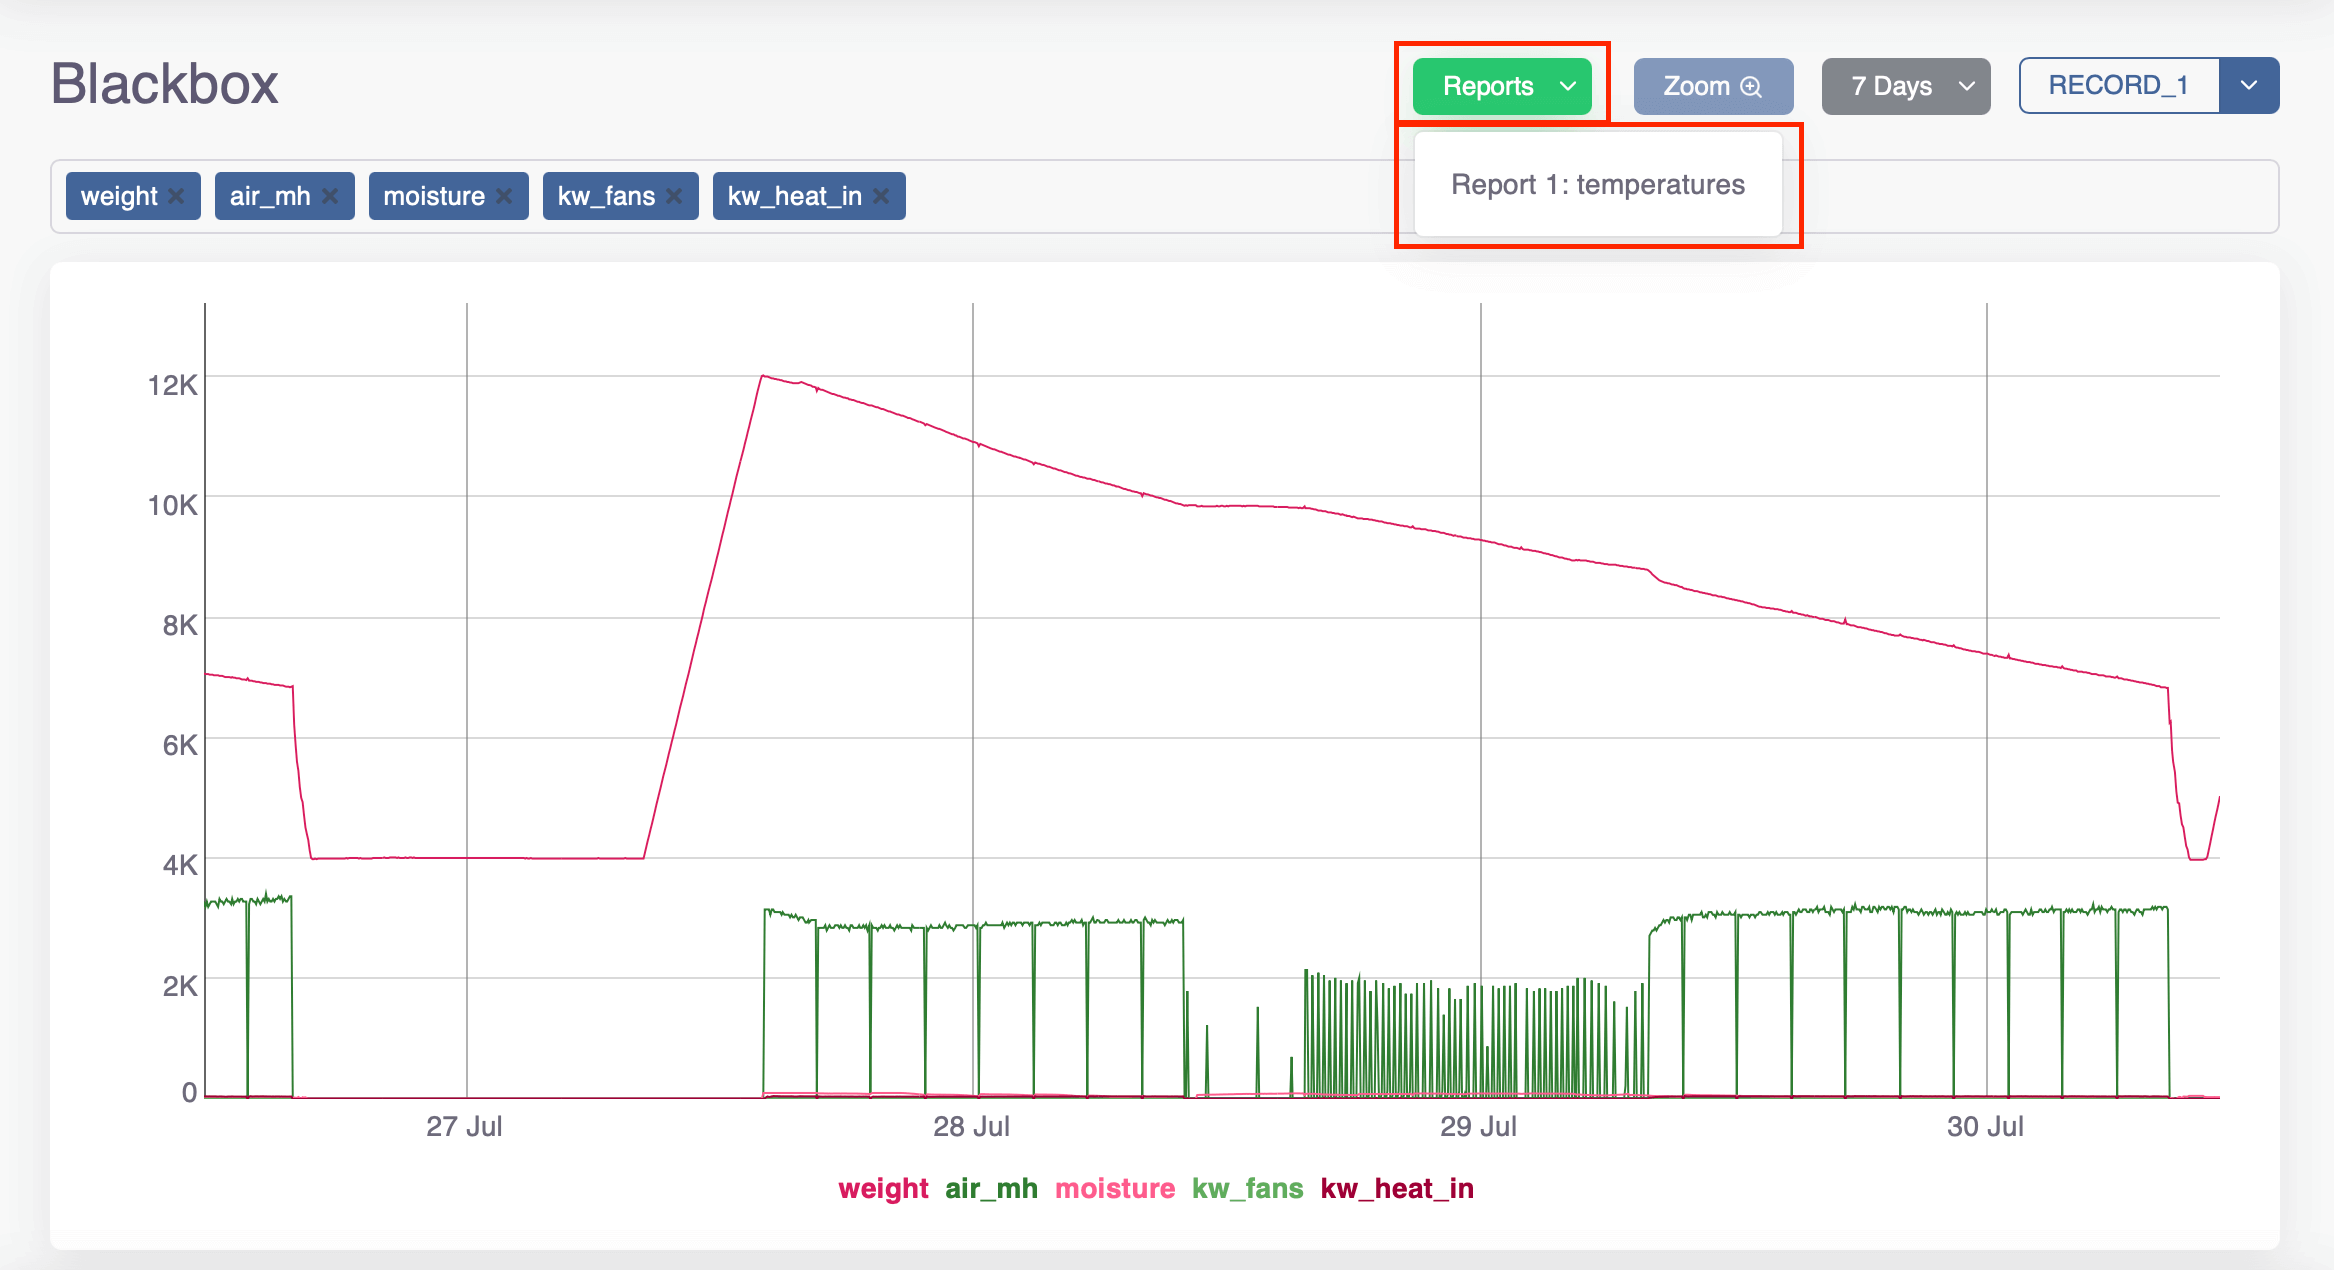
A special "Reports" dropdown button in the Blackbox page is enabled when one or more reports (associated to the same device for which you are currently displaying the chart) are in the published status.
A modal is shown after an item from the dropdown is clicked, and the main report informations are displayed
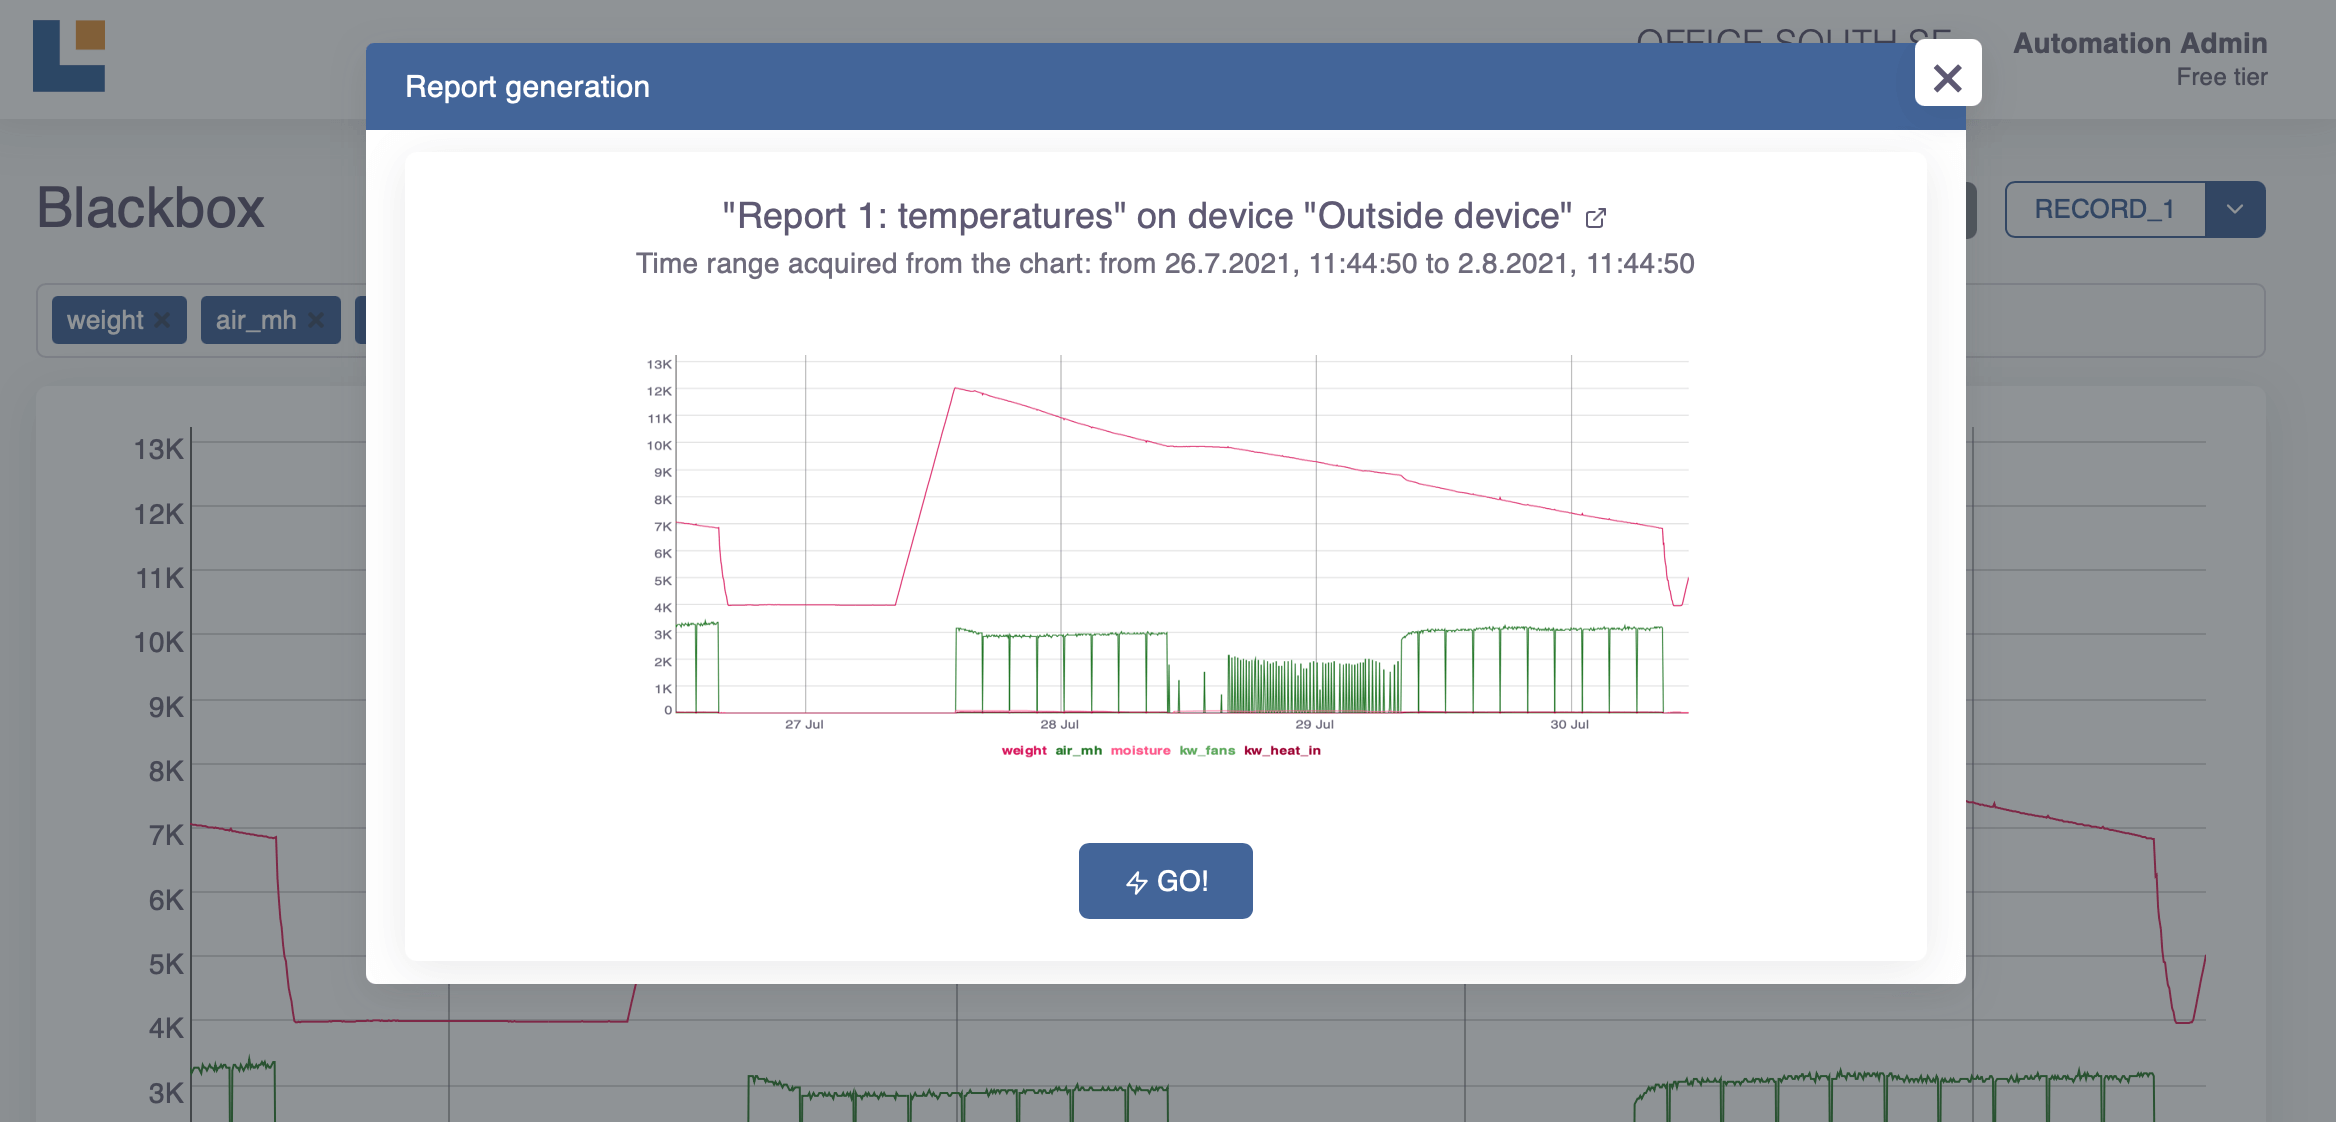
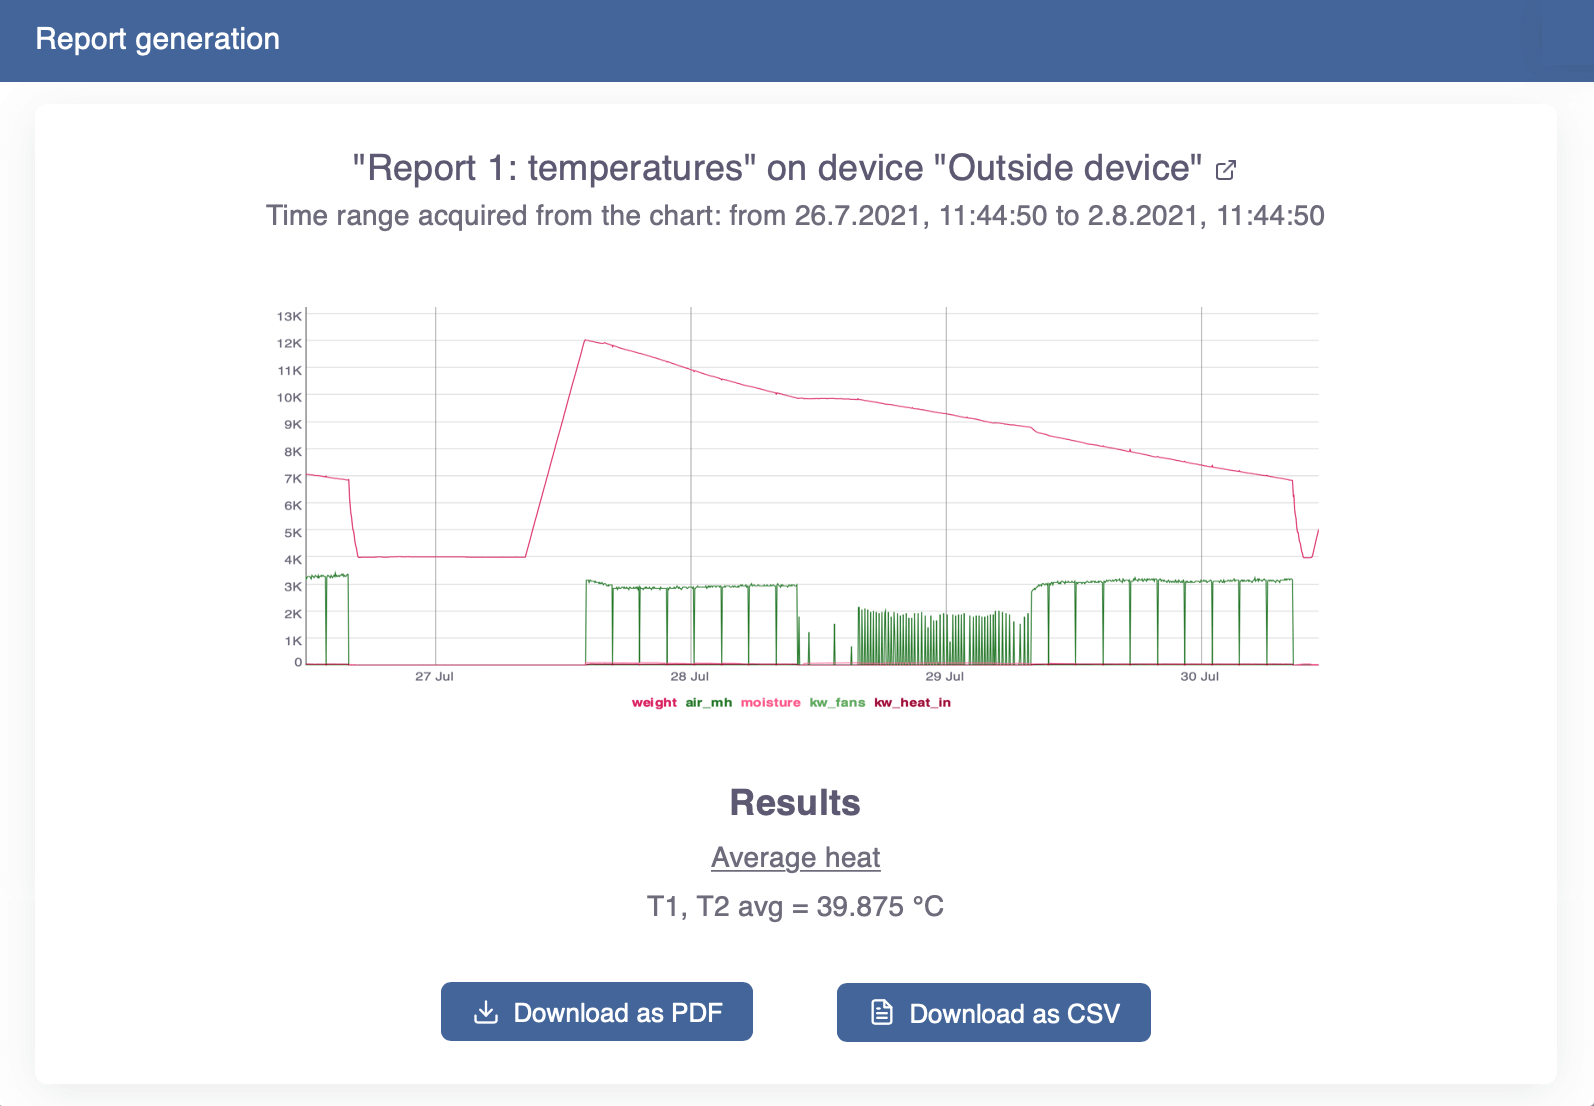
When the GO button is clicked, the report sections and their outputs are evaluated in the same order you defined them, with respect to the chosen time range.
Data can be exported in both CSV and PDF files for your needs.
# Sections
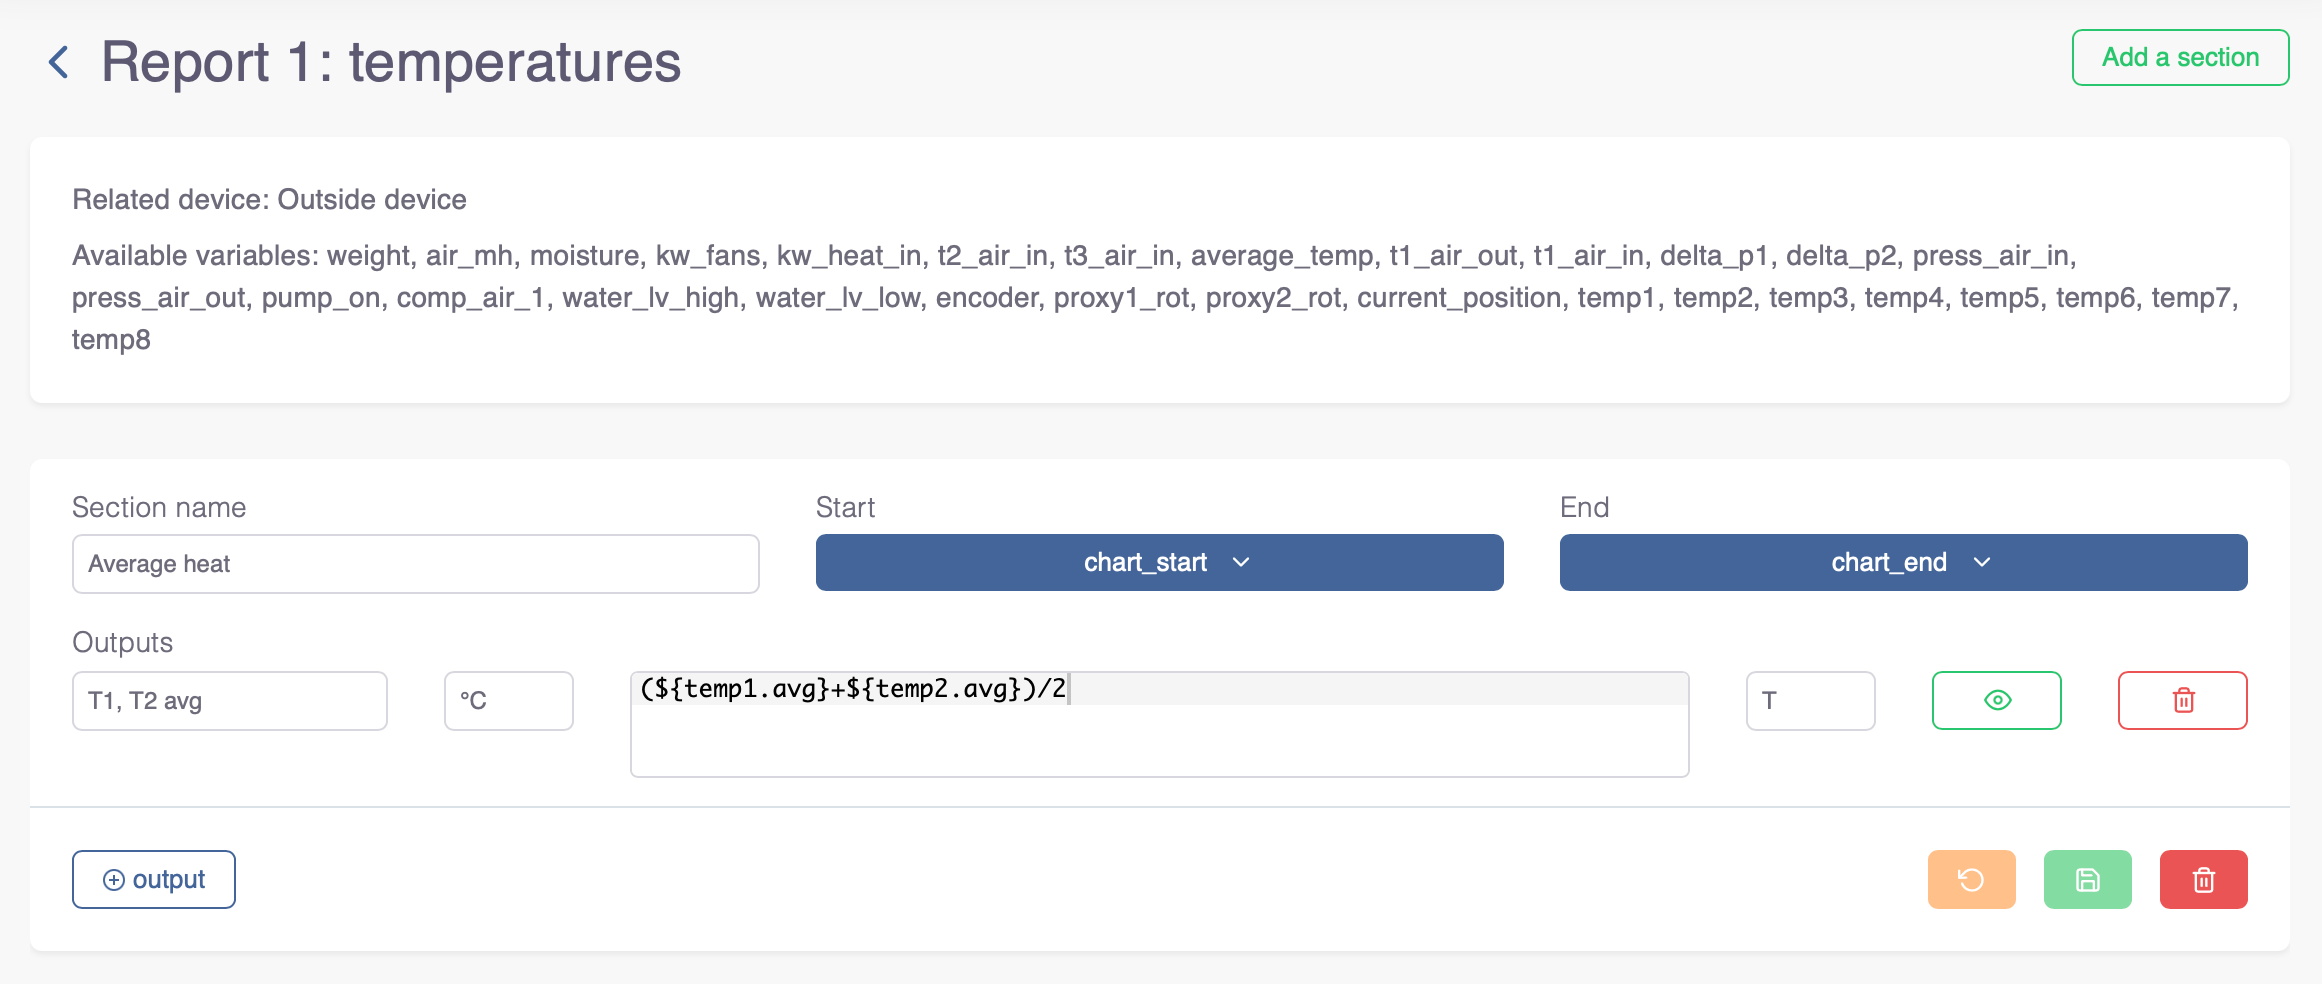
Since every report is linked to one device, on the top of the page a user can browse the variable list from which collecting values from.
Remember that the first necessary step to build your own reports is to sync the desired variables between your PlexusLAB(s) and the Cloud, by setting up a link between them and by creating the desired blackbox on the PlexusLAB.
The user defined sections are shown below the variable list, each one described by:
- Section name, name (a label);
- Start/End, evaluation range;
- Outputs, One or more outputs
Understanding the time range is crucial in order to build complex reports, but it's simpler to come across the outputs documentation first.
# Outputs
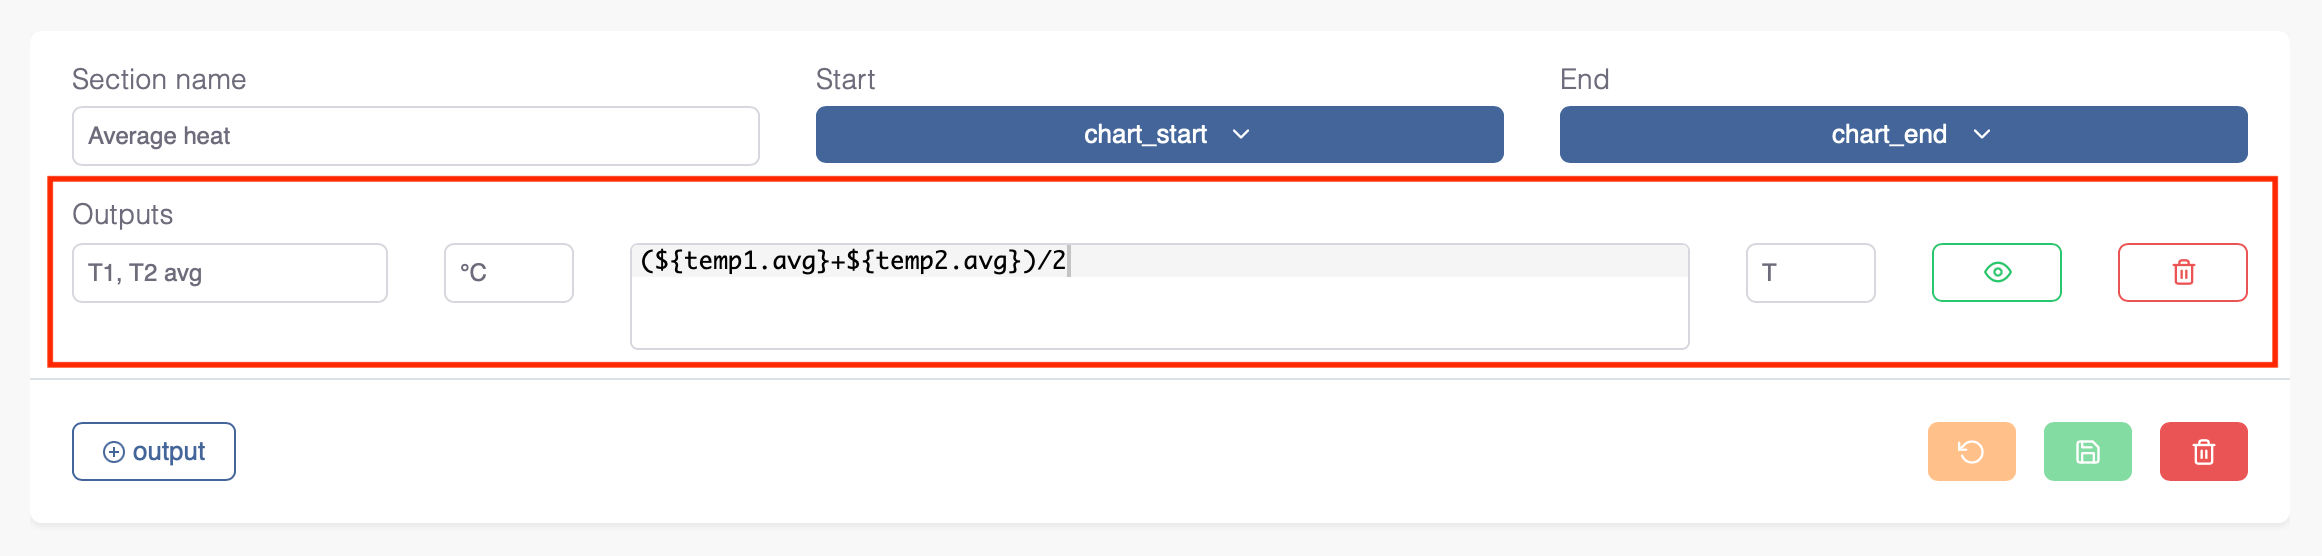
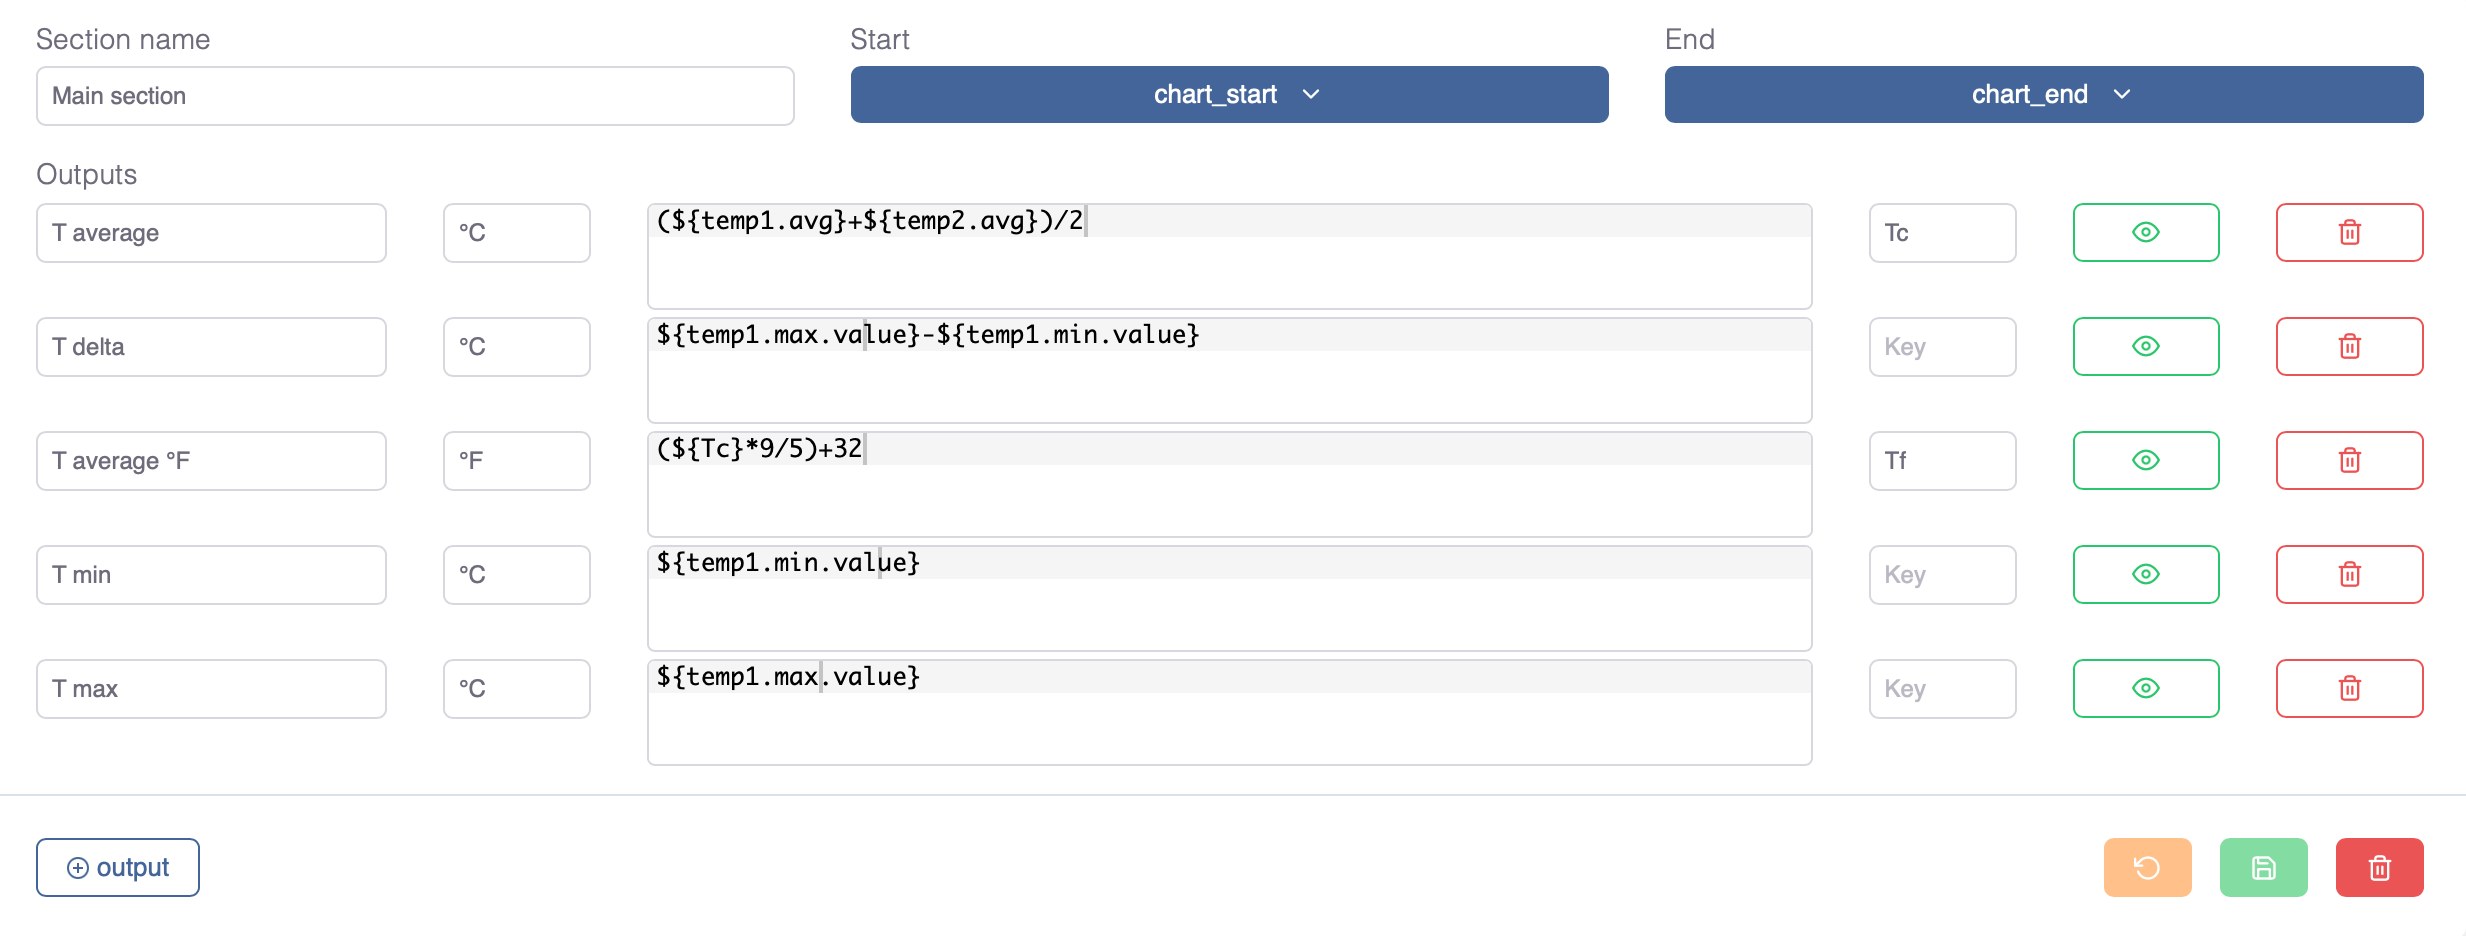
A section must be composed by one or more output(s), that will turn into the final number(s) evaluated inside a report.
Every output is described by:
- Name (a label);
- Unit of measure, optional;
- Formula to be evaluated, mandatory;
- Key, for cascading, to reuse the calculated value inside further output formulas defined after it, optional;
- Visibility, you can hide an output in the report results, especially if you are only interested to use its value to produce other output(s), in a cascading manner
The "Formula" input field is injected with some autocomplete features, to help you insert the formula variables you need.
Autocompletion helps you to write formulas with the correct syntax, so that the evaluation can be performed with no errors. See next paragraph for more details.
# Formulas and variables
The correct way to include a "variable key" inside a formula is to wrap it inside a dollar and curly brackets like this: ${var_name}; autocompletion, once you click on a proposed choice, wraps it in the correct way.
Every single variable measured for the "device" will be mapped into a set of possible keys to be used inside the formula.
For example, if we consider the measured variable temp1, it will be exploded into this useful set of keys (the values are always to be considered with respect to the time range defined for the belonging section)
| Key | NZ | Info |
|---|---|---|
| temp1.first_value | The very first temp1 value (taken at the beginning of the evaluation time range) | |
| temp1.last_value | The very last temp1 value (taken at the end of the evaluation time range) | |
| temp1.avg | * | The average temp1 value |
| temp1.sum | * | The sum of all temp1 values. Notice that the PlexusLAB records values every second, so you have 1 value per second summed into temp1.sum |
| temp1.on_off.on_time | The number of records whose temp1 value was greater than 0. Mostly useful for digital inputs (i.e. On/Off switches or similar) | |
| temp1.on_off.on_time_percent | The percentage of time temp1 value was greater than 0. Mostly useful for digital inputs (i.e. On/Off switches or similar) | |
| temp1.on_off.off_time | The number of records whose temp1 value was equal to 0. Mostly useful for digital inputs (i.e. On/Off switches or similar) | |
| temp1.on_off.off_time_percent | The percentage of time temp1 value was equal to 0. Mostly useful for digital inputs (i.e. On/Off switches or similar) | |
| temp1.on_off.off_on_variations | The number of times the variable switched from 0 to a value greater than 0. Mostly useful for digital inputs (i.e. On/Off switches or similar) | |
| temp1.on_off.on_off_variations | The number of times the variable switched from a value greater than 0 to 0. Mostly useful for digital inputs (i.e. On/Off switches or similar) | |
| temp1.max.value | * | The maximum value recorded for temp1 |
| temp1.max.utc | * | The UTC time in which the maximum value was recorded for temp1 |
| temp1.max.human | * | A human readable string representing the time in which the maximum value was recorded for temp1 |
| temp1.min.value | * | The minimum value recorded for temp1 |
| temp1.min.utc | * | The UTC time in which the minimum value was recorded for temp1 |
| temp1.min.human | * | A human readable string representing the time in which the minimum value was recorded for temp1 |
TIP
Keys identified with NZ are also available with a simple variation that excludes values equal to 0.
This may be needed in some cases where the PlexusLAB was unresponsive for a specific time range (that is, it recorded a zero-value) leading to undesired and misleading 0 values in the measurements.
The _nozero versions of those keys allows you to ignore them and evaluate, for example, the average of temp1 without considering values equal to 0; it becomes very useful in some cases where you are pretty sure that you are measuring a heat sensor and the environment is always somewhere between 20°C - 40°C, a positive temperature range, and you obtain a 0 value for the temp1.min.value
# User-defined keys
If you provide an output with its own key, it will be handled like standard keys in the outputs that come after it. In fact, the autocomplete feature will treat it as a
TIP
An user-defined key-value can be overridden (by using the same key in two or more different outputs) and it will be updated everytime it gets evaluated again.
For example, you could define K1 for the first output of the first section, then use K1 in the following output formula. Then, you can re-assign K1 for the third output and from that moment the value of K1 will be assigned the value evaluated for the third output.
# Time range
Every single section contains information about the evaluation time range because, obviously, every report must have a starting and an ending point. By default, they are set to chart_start and to chart_end respectively, but what does that mean?
Every report evaluation starts from the blackbox page, so the chart_start and chart_end points are the first and last point for the actual chart you'll be analysing. And this probably handles a huge set of possible reports that one could imagine..
..but, when we designed the report interfaces for our Plexus Cloud we wanted to create something powerful and tweakable. That's why we decided to give you the opportunity to create sections, outputs, user-defined keys and, most of all, customizable time ranges, as described by the help of the following examples.
# Simple time range example
If we define a section with chart_start and chart_end
When evaluating, the interval is acquired from the actual chart graph, as follows:
- chart_start => acquires chart first point = 26 July 2021 @ 15:43:32
- chart_end => acquires chart last point = 2 August 2021 @ 15:43:32
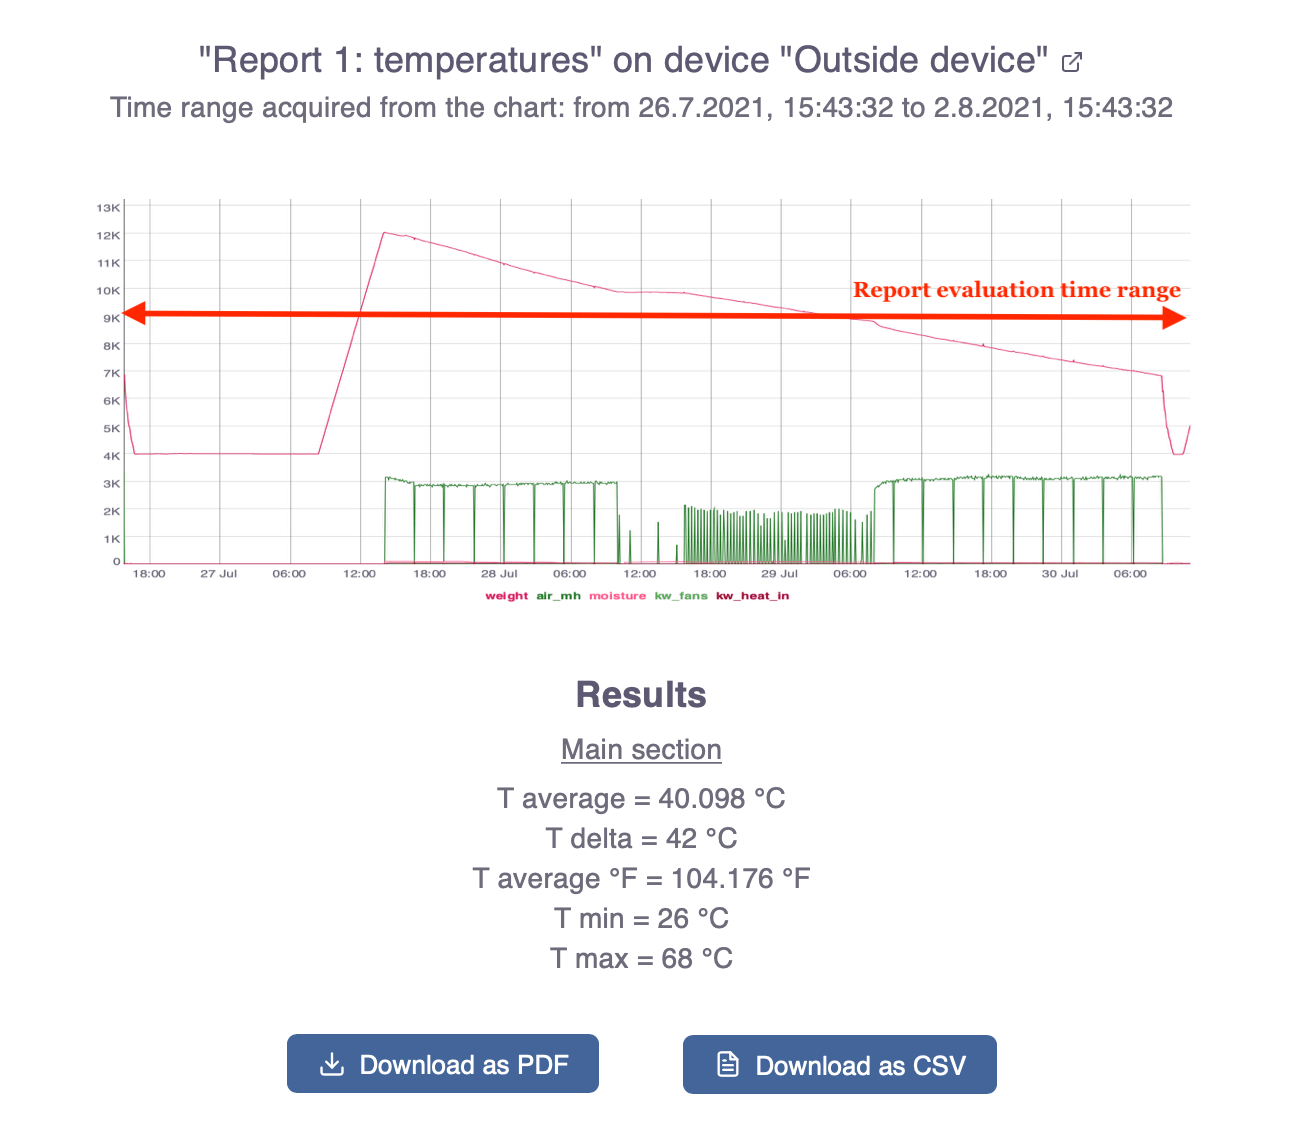
TIP
You can generate a report using variables that belongs to a chart that you're not currently watching, like in this example: temp1 variable is measured from the same PlexusLAB device, but it is associated to another blackbox.
# Complex time range example
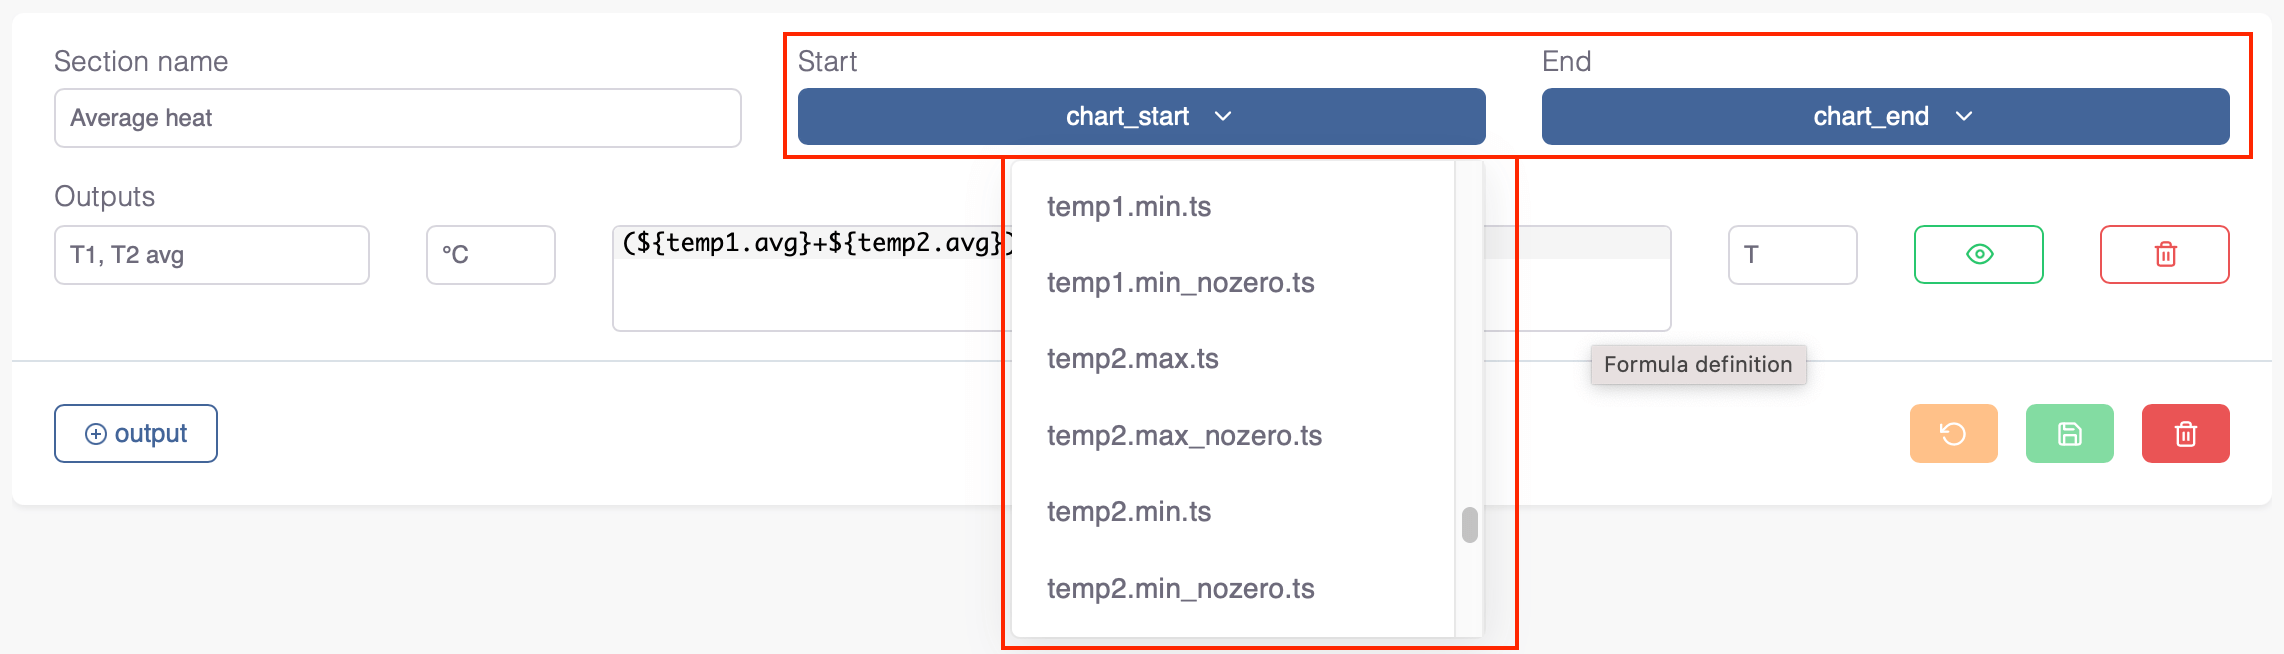
When choosing a different value from the dropdown, a user will evaluate outputs on a sub-range of the current chart time range.
It's important to remember that the graph entire time range is always taken into account because the choice is always subordinated to a bigger time range, represented by the chart extremes.
Every single variable measured for the device will be mapped into a set of possible keys to be used as non-standard time range extremes.
For example, if we consider the measured variable weight, it will be exploded into this option set
| Key | NZ | Info |
|---|---|---|
| weight.max.ts | * | The timestamp in which the maximum value was recorded for weight |
| weight.min.ts | * | The timestamp in which the minimum value was recorded for weight |
Comparing the "simple time range" and the "complex" one, we notice:
For the first section, "Main section":
- chart_start => acquires chart first point = 27 July 2021 @ 09:40:55
- chart_end => acquires chart last point = 30 July 2021 @ 10:19:44
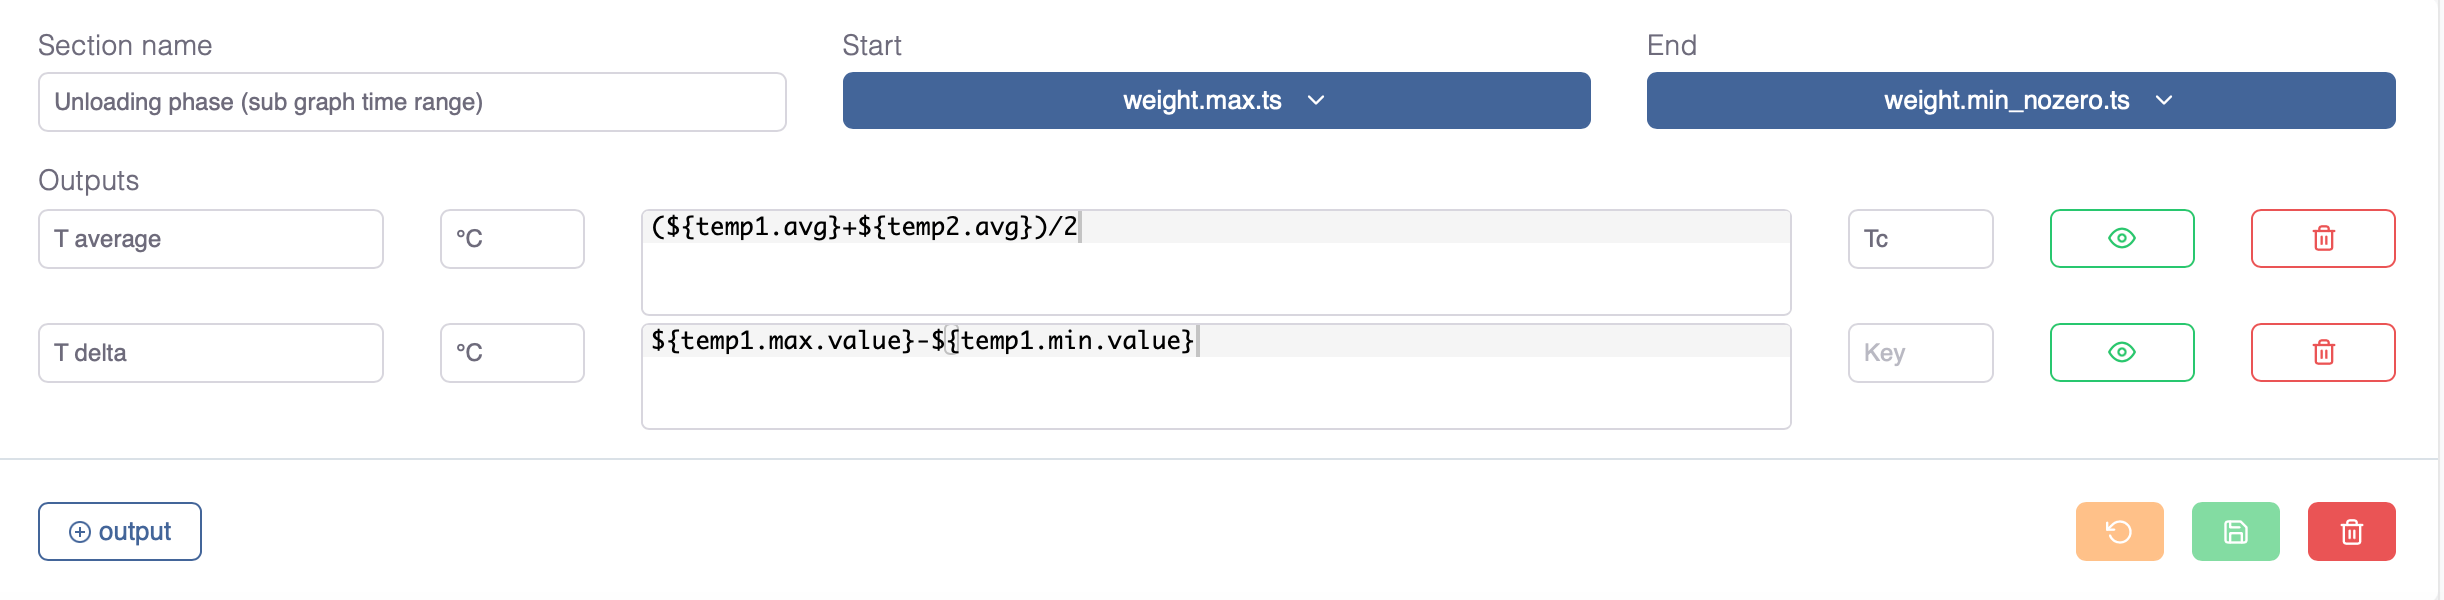
For the second section, "Unloading phase":
- weight.max.ts => 27 July 2021 around 14:30
- weight.min.ts => 30 July 2021, in the last part of the chart
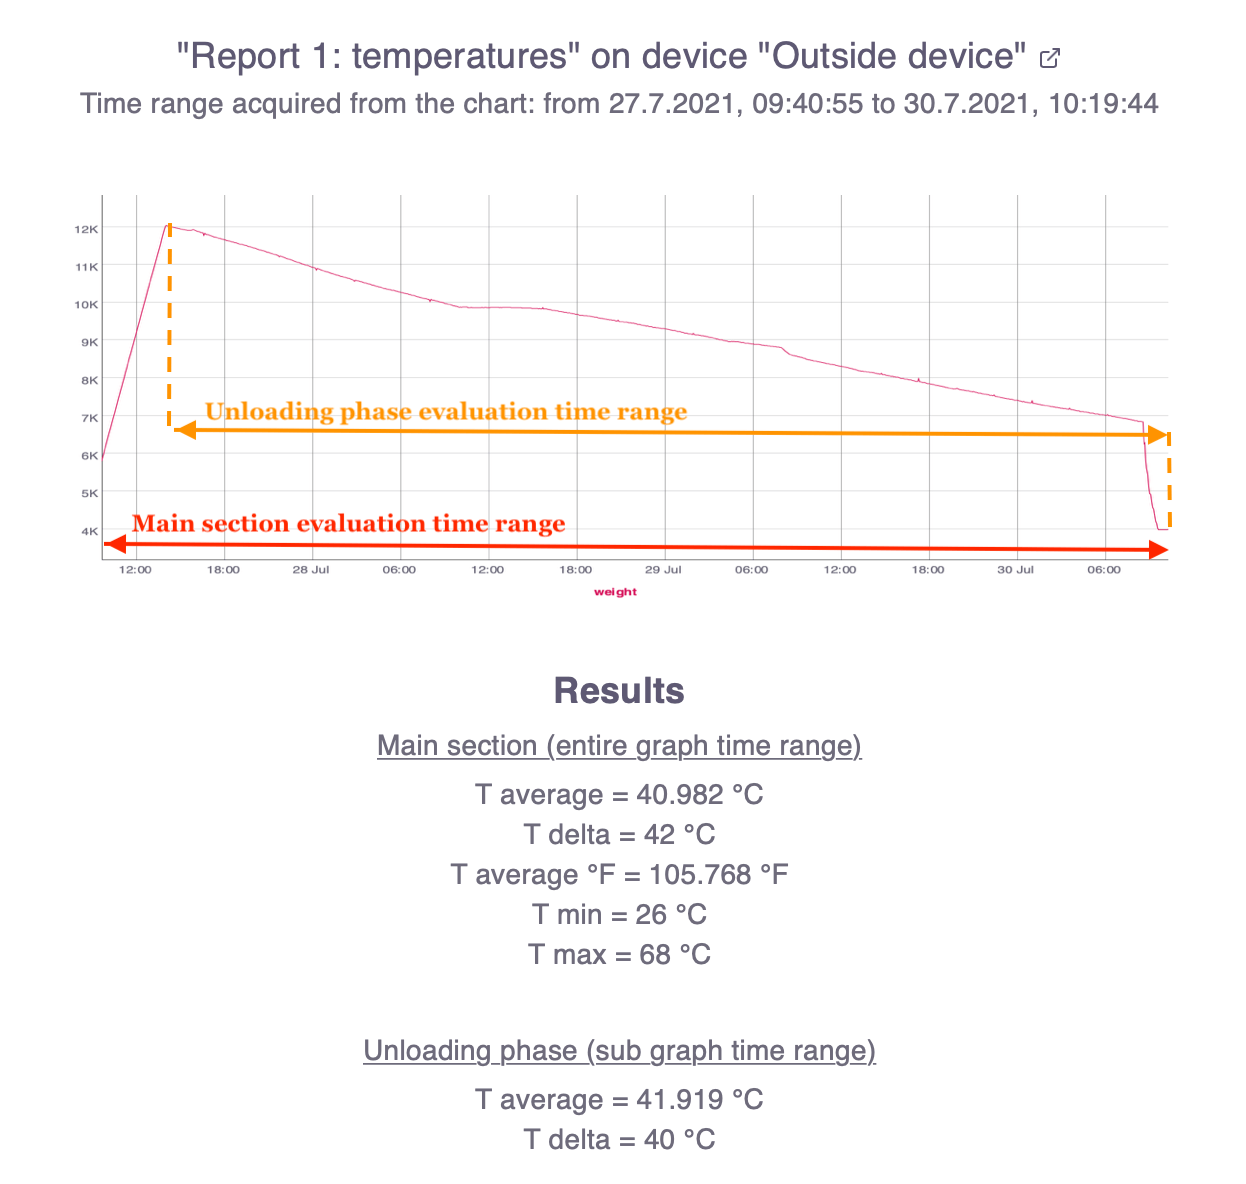
As you can see from the results, the evaluated temperature values differs even if their formula definitions are exaclty the same in both the two sections