# Using the Cloud
After logging into the Plexus Cloud (opens new window) a list of project is shown, may they be yours ("Owner" badge showing) or you were invited to contribute with a specific permission level.
Depending on the project you are managing, you will belong to one of the following four roles, which are related to a set of permission, described in detail in the following documentation sections.
# Roles table
| Role | Info |
|---|---|
| Owner | All the pages are available, and user is granted CRUD (create / read / update / delete) permissions to any resource |
| Admin | All the pages are available, and user is granted CRUD (create / read / update / delete) permissions to any resource, except for deleting the project and managing user invitations |
| Supervisor | All the pages are available, and user is generally granted only read permission to resources, see further details below |
| Operator | All the pages are available except for "Users", and user is generally granted only read permission to resources, see further details below |
# Projects
In the projects startup page you can create your own project by clicking on "Create new" and filling the form, or you can enter into an existing one.
Once a project is selected, a set of pages are available to navigation, as described in the next paragraphs.
The Settings page can be used to update or delete the project itself, depending on your role.
# Permission levels
Considering a specific project
| Role | Read | Update | Delete |
|---|---|---|---|
| Owner | check | check | check |
| Admin | check | check | clear |
| Supervisor | check | clear | clear |
| Operator | check | clear | clear |
# Devices
In this page you are able to link one or more PlexusLAB device(s) to the project, as well as connect to the PlexusLAB using its direct link (for example a public address, if it exists), or by opening a tunnel.
When creating a device you must assign a name to it, and optionally a short label, useful to keep Mixed Charts more readable.
To open a tunnel, click on the "Open" button under the "tunnelling" column and wait for the corresponding PlexusLAB device to detect your request and do the hard job for you. You should see a button to open the tunnel link after ~10/15 seconds.
# Permission levels
| Role | Create | Read | Update | Set Tunnel Status | Delete |
|---|---|---|---|---|---|
| Owner | check | check | check | check | check |
| Admin | check | check | check | check | check |
| Supervisor | clear | check | clear | check | clear |
| Operator | clear | check | clear | check | clear |
# Device on maintenance
Once Maintenance mode or Emergency mode are activated from the HMI Panel then this status is properly highlighted even on PlexusCloud. The relative Project and device have a red/white coloured background. More details on maintenance mode here.
# Blackbox
In this page you are able to view the blackboxes set up from the PlexusLAB.

- REPORT, choose which report to apply to the selected chart;
- EXPORT,export charts data to CSV format;
- ZOOM, load the proper amount of data, according to selected time range;
- TIME RANGE, choose a specific time interval you want to visualize;
- CHARTS LIST, choose from different available charts
You can select a chart by using the dropdown, select specific time ranges directly on the chart and reload more accurate data for the actual zoom you are using.
Select a specific chart clicking onto the top right drop-down window. Properly set the time range and reload the new data set clicking on "zoom".
WARNING
Keep in mind that only a limited set of records (points) is actually showed according to the diagram time range. The larger the time range you select, the more disperse the points are; viceversa, the shorter the time range is, the more frequent the points are.
A good rule of thumb is to remember that ~2500 equally distributed points are downloaded and drawn in the window (it would be too heavy for the browser to load more).
Every time data is requested from the server, a "snapshot" is created (time interval and loaded data are temporary memorized): this allows to move very easily through different periods.
You can export the currently displayed data as a raw CSV file with the "Export data" button in the upper bar. Plexus Cloud let you choose from 3 different ways to export data:
- Downsample, export 1 data every N displayed values;
- Resample, export 1 data every N minutes;
- Export All, export all displayed values
Once a chart is loaded you can trigger a report generation, if any report was configured for the current device you are actually monitoring. Click here for more informations about the report generation.
# Mixed Charts
In this page you are able to create and view custom-created charts which combine data coming from 2 or more devices.
WARNING
Notice that the "Mixed Charts" navigation tab is available only when there's more than one device set up and connected to PlexusCloud, as described in the setup page.
The interface itself is pretty straightforward and it's very similar to the Blackbox because the UI and UX behave the same way; the only difference is that Blackbox charts are synced with your devices, while Mixed Charts has to be configured on PlexusCloud: you can refer to the Mixed Chart page for more informations on how to create, edit and delete mixed charts.
# Permission levels
| Role | Read | Delete |
|---|---|---|
| Owner | check | check |
| Admin | check | check |
| Supervisor | check | check |
| Operator | check | clear |
# Reports
In this page you are able to manage reports for your blackboxes or your mixed charts, as described in details here.
You can use reports to extract and produce CSV or PDF files with simple or combined data coming from your blackbox. For example:
- if you measure the weight of a fluid using an analog sensor, you can evaluate the weight loss in a specific time range
- if you acquire the status of a valve (open/close), you can count how many times it opened in the last 24 hours
# Permission levels
| Role | Read | Update | Delete |
|---|---|---|---|
| Owner | check | check | check |
| Admin | check | check | check |
| Supervisor | check | check | check |
| Operator | check | clear | clear |
WARNING
Supervisors have limitations: they can only update and delete their own reports.
# Alerts
Use this page to view alarms and warnings raised from the PlexusLAB device(s) linked to the project.
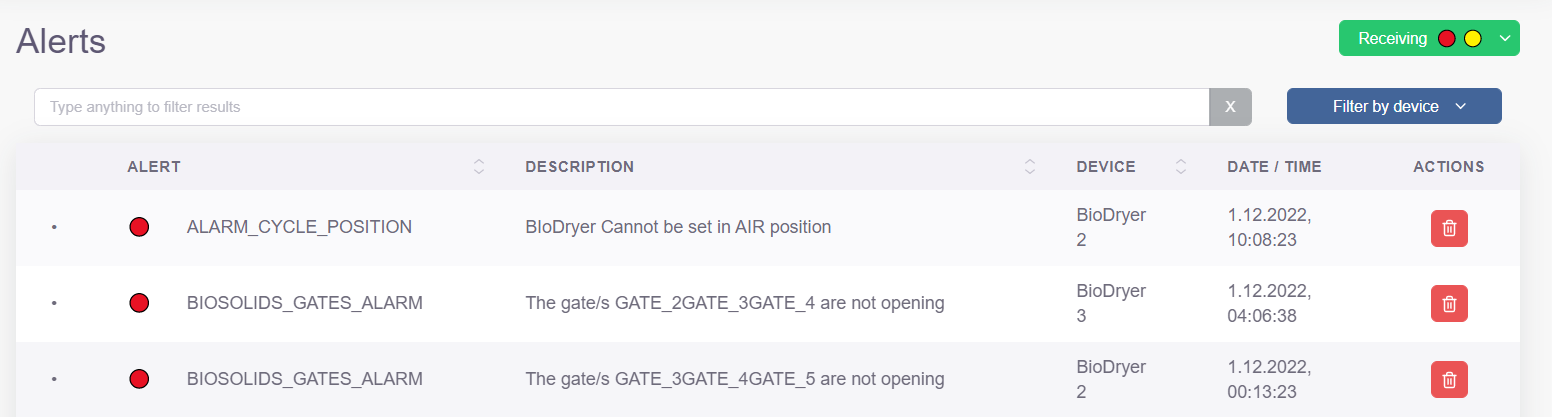
TIP
It's possible to turn on / off e-mail notifications by clicking on the top right green button.
- Starting from PlexusLAB 0.20.3, there are many available options to select which kind of notifications you want to receive. These are both alarms and warnings, alarms only or none of them.
| Icona | Azione |
|---|---|
| Turn on all notifications (warnings and alarms) | |
| Turn on alarms notifications | |
| flash_off | Turn off all notifications (warnings and alarms) |
- These choices are not available for previous PlexusLAB versions.
# Permission levels
| Role | Read | Delete |
|---|---|---|
| Owner | check | check |
| Admin | check | check |
| Supervisor | check | check |
| Operator | check | clear |
# Backups
In this page you are able to view the backups sent from the PlexusLAB device(s) you linked to the project.
# Permission levels
| Role | Read | Delete |
|---|---|---|
| Owner | check | check |
| Admin | check | check |
| Supervisor | check | clear |
| Operator | clear | clear |
# Users
In this page you are able to view the users that can operate on the project, and their role.
WarnUsers page is unavailable for an "Operator" user.
Only a project owner can edit the user list, and invite existing Plexus Cloud users by using their email address and assigning them a role.
# Settings
In this page you are able to view the project details.
WarnProject Key field is hidden for an "Operator" user.
# Permission levels
| Role | Read | Update | Delete |
|---|---|---|---|
| Owner | check | check | check |
| Admin | check | check | clear |
| Supervisor | check | clear | clear |
| Operator | check | clear | clear |
← Setup Mixed Charts →