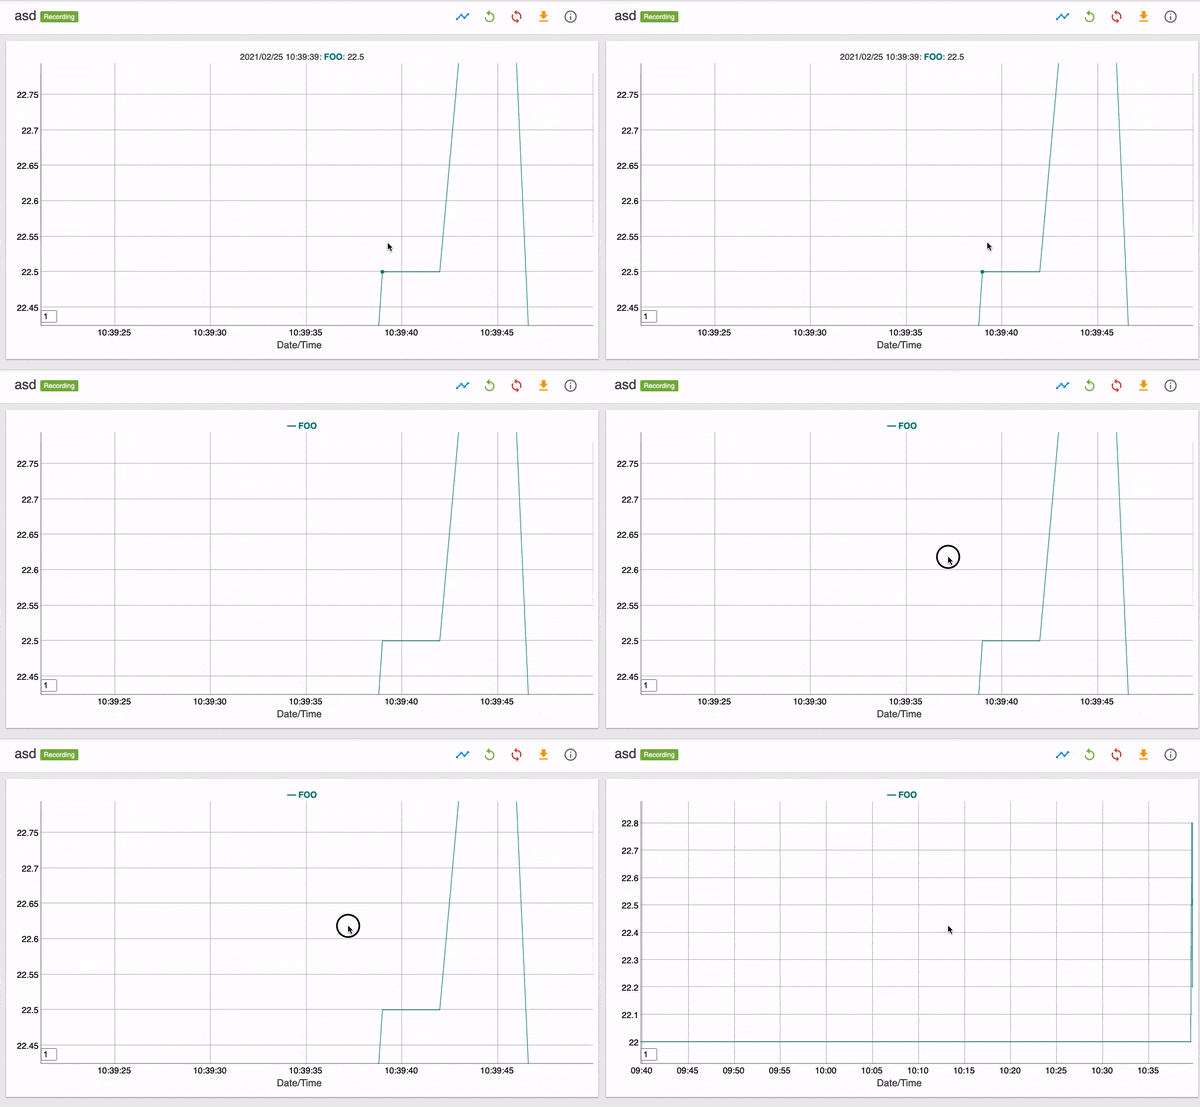
# Blackbox
This page manages the blackbox that allows user to record data and display it on graph.
# Side Panel
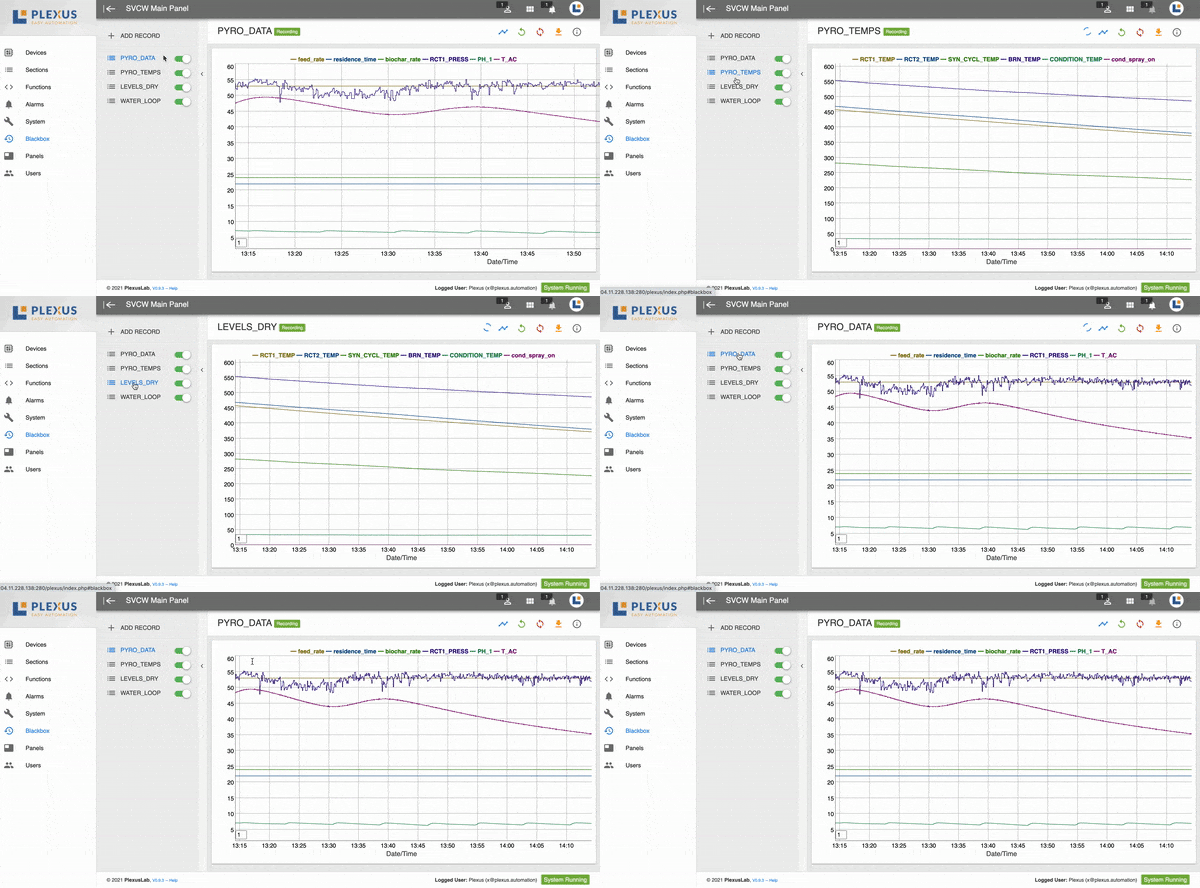
Blackbox side view allows you to add new record. It is done by clicking on the 'ADD SECTION' button on the side panel, which opens a modal with the following elements;
| Name | Information |
|---|---|
| Name | Name for your blackbox |
| Variable | Variable to record into your blackbox |
| Visibility | Checkboxes for visibility configuration, based on user role |
Every graph is provided with an a "ON/OFF" button so it is possible to choose whether visualize it or not and save related data.
# View
Blackbox main view details.
# Blackbox Top Bar
Every Blackbox Record have a top bar with multiple actions.
| Icon | Name | Information |
|---|---|---|
| - | Status | Stopped Status For Stopped Recording Recording Status For Start Recording |
| timeline | Timeline | Choose a range of time / day / week / month to view your graph |
| replay | Load Selection | Load selected graph of your timeline |
| sync | Live | Get constant data from your variable , update every second |
| file_download | Download Blackbox | Download your blackbox data into CSV Format |
| info_outline | Info | Info modal that allow you to add / delete variable |
# Navigating the Graph
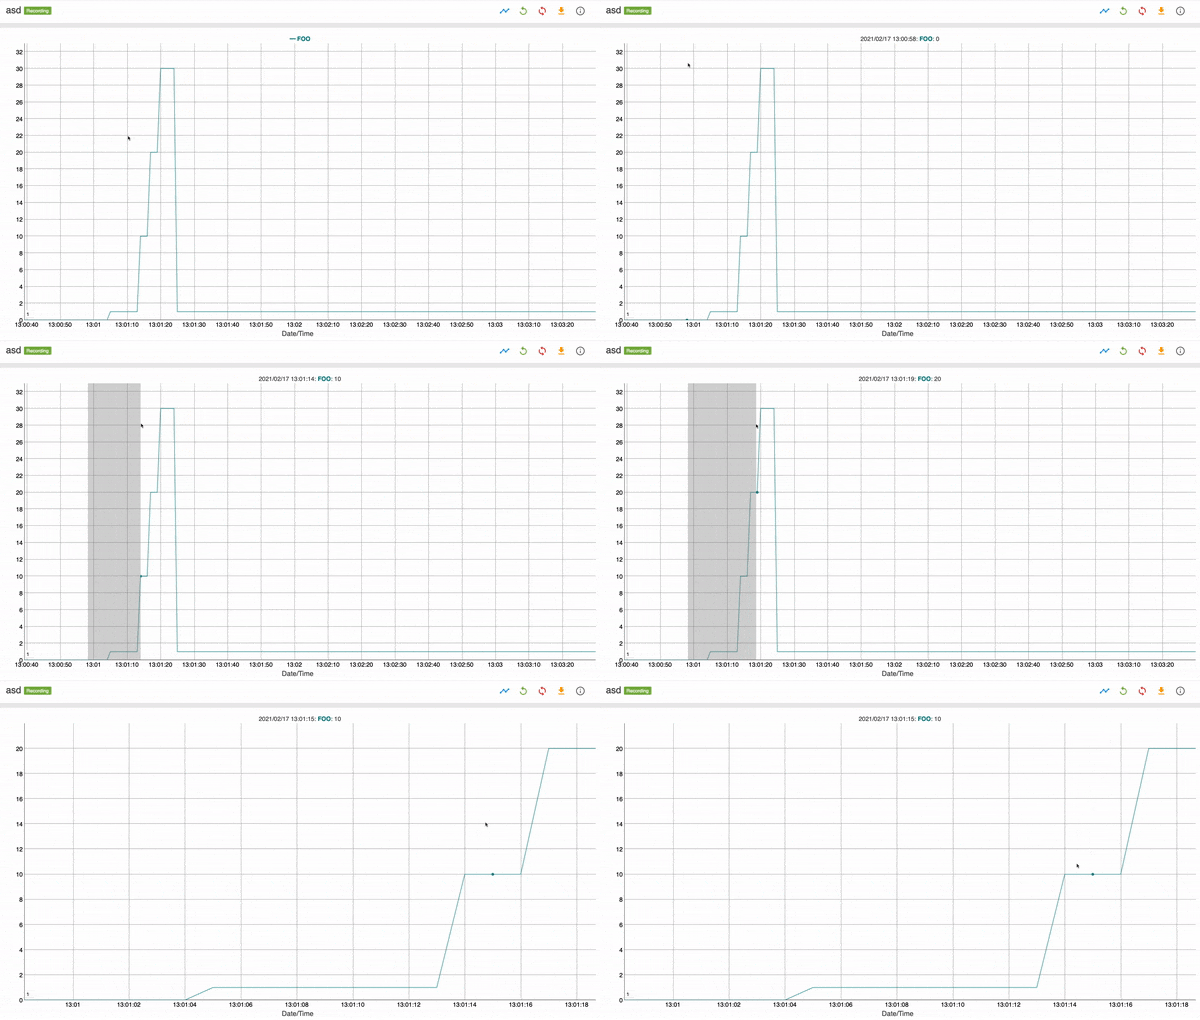
# Zoom In - X Axis
Drag left click to zoom in.
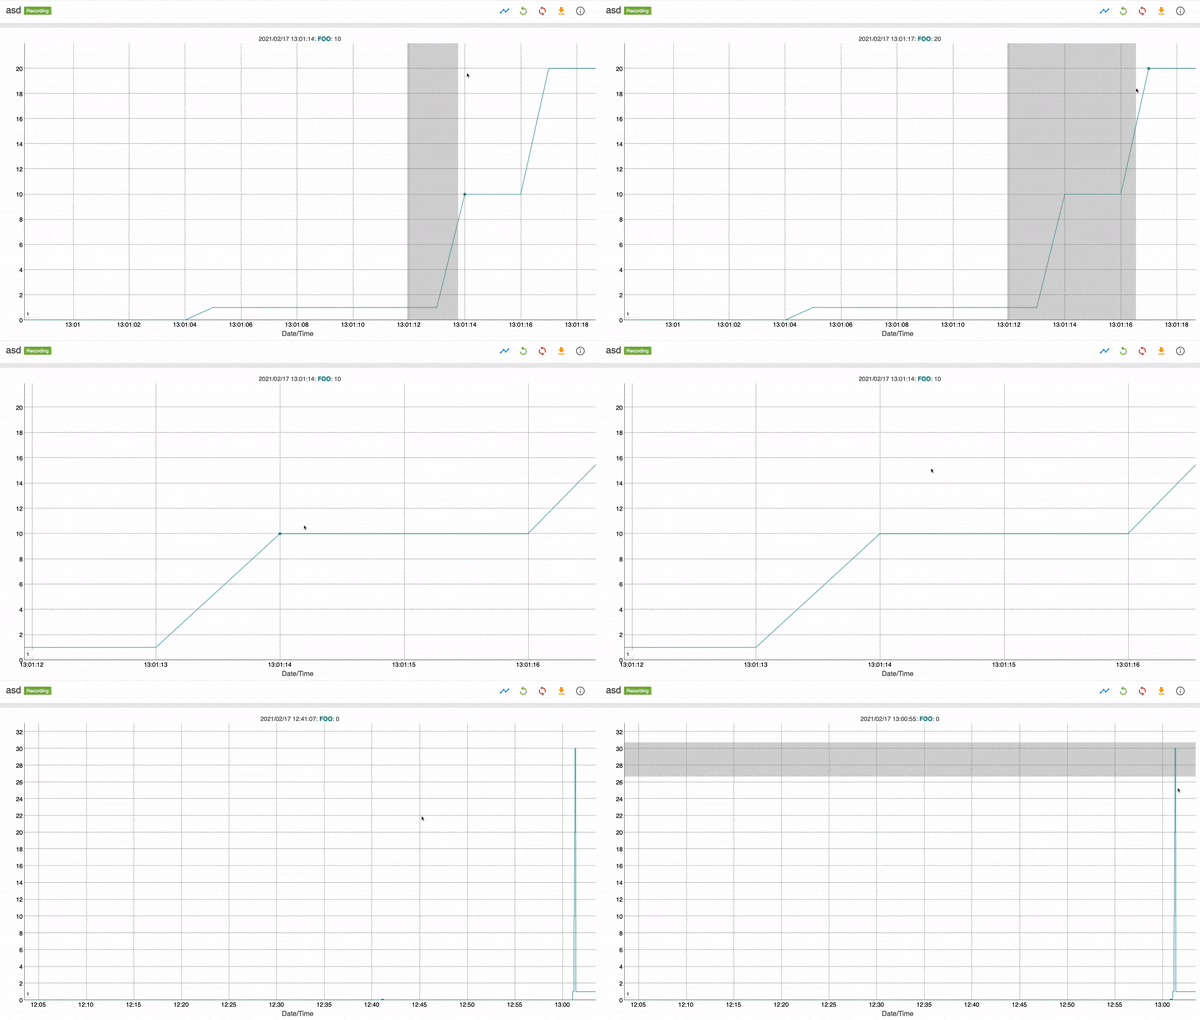
# Zoom Out - X Axis
Double click to zoom out.
# Zoom In - Y Axis
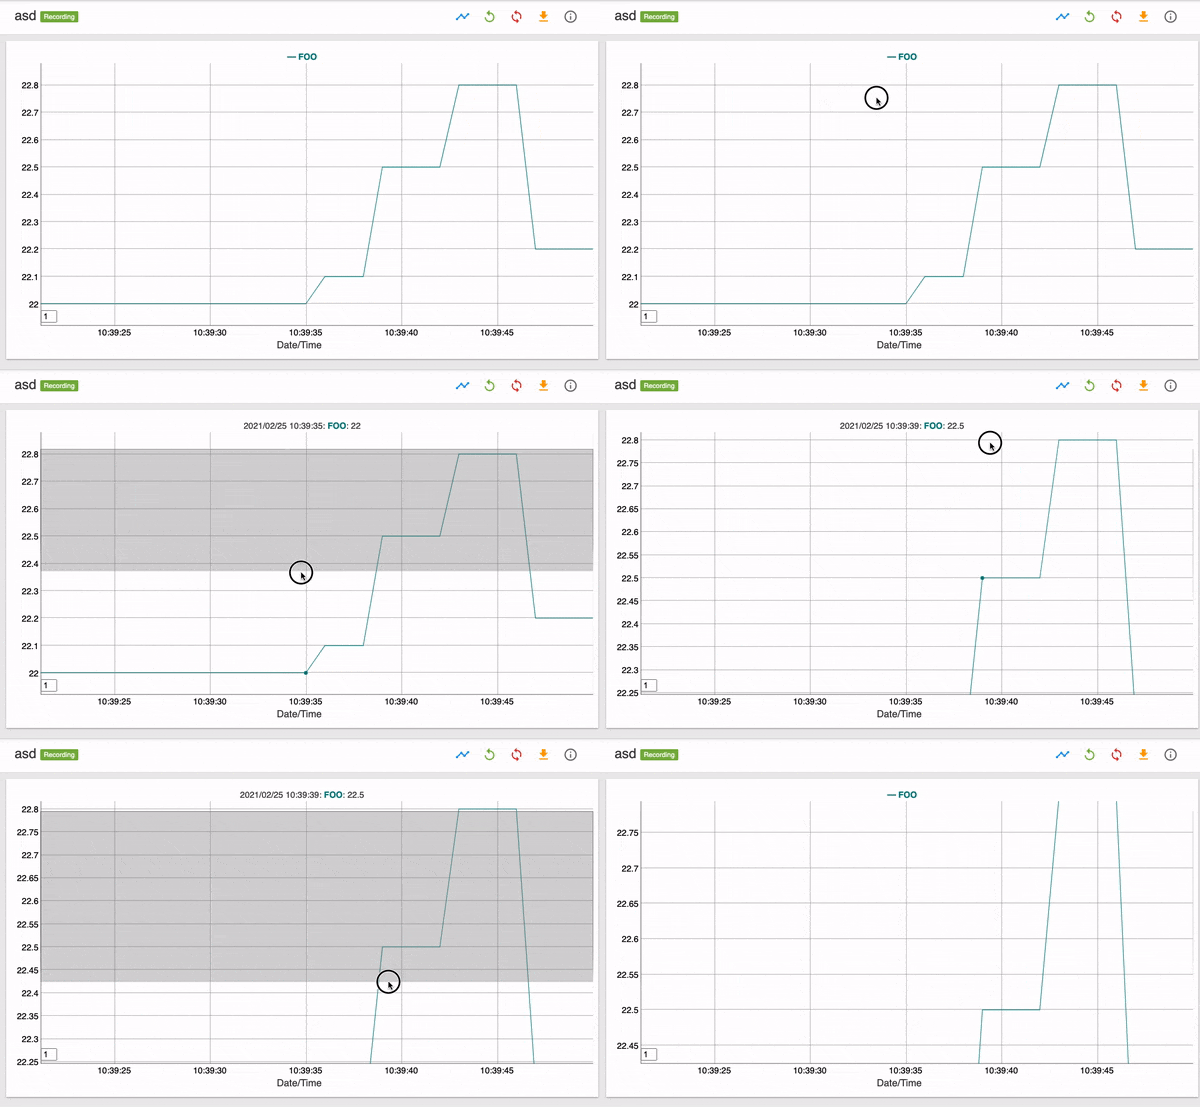
# Zoom Out - Y Axis
Double click to zoom out.
